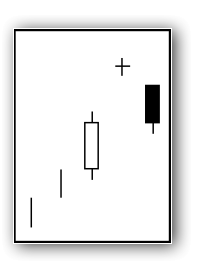
I can’t imagine trading without candlestick charts. Though I do not use the classic patterns for my analysis, I find they they offer a greater depth of information than  traditional bar charts – where the high and low are emphasized – candlesticks give emphasis to the relationship between close price and open price. This is a guide that explains most of the most common candlestick patterns for reference.
The History of Japanese Candlesticks
In the 1700’s a Japanese man named Munehisa Homma, a trader in the Osaka rice futures market, developed a method of technical analysis to analyze the price of rice contracts known as candlestick charting. Homma used Sakata’s Five Methods, patterns derived from rules used by local traders from his hometown of Sakata, as the foundation for his Candlestick Charting analysis. Candlestick analysis had been developed over the years simply due to the tracking of rice price movements. However, in the mid 1700’s they were really fully utilized. “The god of the markets” Homna came into the picture. Munehisa Homna, the youngest son of the Homna family, inherited the family’s business due to his extraordinary trading savvy. This at a time when the Japanese culture, as well as many other cultures, thought it common that the eldest son should inherit the family business. The trading firm was moved from their city, Sakata, to Edo (Tokyo). Homna’s research into historic price moves and weather conditions established more concrete interpretations into what became known as Candlesticks. His research and findings, known as “Sakata Rules” became the framework for Japanese investment philosophy.
After dominating the Osaka rice markets, Homna eventually went on to amass greater fortunes in the Tokyo exchanges. It was said that he had over one hundred winning trades in a row. His abilities became legendary and were the basis of Candlestick analysis.
Japanese Candlestick analysis was never a hidden or secretive trading system. It was successfully used in Japan for hundreds of years. It has been only recently, about 25 years ago, that it first made its way into the U.S. trading community. Until then, there just wasn’t any interest from Western cultures to investigate the Candlestick Technique. Even then, it was not noticed all that much. The perception has been that it was difficult to learn and very time consuming. That may have been true until recently. The first books introducing it into the U.S. trading arena would describe how to make wooden boxes that were backlit. Then the chart graphs could be better viewed. Fortunately, the advent of computers and computer programming has taken Candlestick analysis ahead by leaps and bounds.
Until recently, the investment community knew about Candlesticks, they just didn’t know how to use them effectively. Interest has been increasing dramatically now that the roaring markets have collapsed. Investors, new and old, are now trying to investigate methods that protect them from the severe losses that occurred from March 2000 until now.
Hundreds of years of analysis and interpretation can be much more easily extracted through computer programming. Huge fortunes were amassed with simple charting techniques. The same will be true with all the benefits that computer software provides the investor today.
